Patexia Insight 173: Soaring and Stalling Nations in Patent Landscape
Last week, we published our fifth annual Patent Intelligence Report, which covers the patent prosecution landscape between Jan. 1, 2018, and Dec. 31, 2022. This year we considered attorney interview with the USPTO as an additional measure of attorney’s activity. This has resulted in an updated ranking methodology for attorneys’ activity rankings. In addition to assessing the activity, efficiency, and performance of various stakeholders, including attorneys, agents, law firms, and patentees, among others, the report also provides a range of statistics related to patent prosecution. One of the noteworthy features was the ranking of countries that saw the highest average growth and decline in the number of patents issued during the past five years.
As covered in Patexia 172, foreign entities have been highly active in the past few decades, with an average share of 47.9% of total patents issued over the past five years, increasing to 49.2% in 2022. Although the overall share of patents has remained stable, the country-level data is dynamic, with different nations constantly swapping places by either growing or declining their patent numbers from year to year. By taking into account only countries with at least 1,000 patents issued in the past five years, we computed their average growth to identify potential future innovation leaders. In the chart below you will find the top five countries with the highest average yearly growth and decline in the number of patents issued in the U.S. between 2018 and 2022, based on assignee country data.
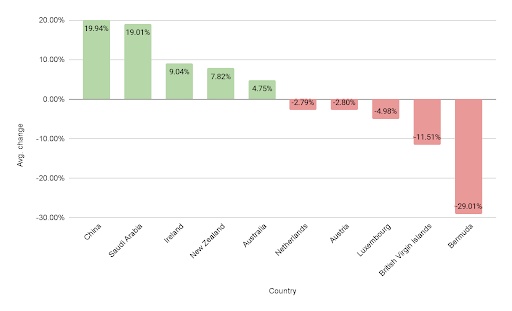
- China leads the ranking among the fastest-growing nations by the number of issued patents, with an average yearly growth rate of 19.94%. Over the past decade, the Chinese government and local businesses have made substantial investments in research and development, fostering a robust culture of innovation in China that has resulted in numerous new inventions and technologies. Moreover, Chinese firms are expanding their global reach, including in the United States, and are pursuing patent protection in these markets. The growth in patents is consistent with the broader trend observed nationally in China and is also reflected in the country's international PCT patent filings as well as those at the European Patent Office.
- Saudi Arabia closely follows China with a growth rate of 19.01%. Saudi Arabia has made significant investments in research and development (R&D) in recent years, with a particular focus on science, technology, and innovation. This investment is part of the country's Vision 2030 initiative aimed at diversifying the economy and reducing reliance on oil. Saudi Arabia has also taken steps to create a more innovation-friendly environment by providing tax incentives, funding research projects, and establishing partnerships with leading research institutions worldwide. Notably, the Saudi Arabian Oil Company, one of the country’s key players, was one of the companies mentioned for the largest growth according to their issued number of patents.
- Ireland, New Zealand, and Australia close the top five growing countries with average yearly growth rates of 9.04%, 7.82%, and 4.75% respectively. Ireland has been increasingly focusing on technology and innovation, attracting major global companies to set up their European headquarters in the country. This has led to a rise in research and development activities and patent filings. They have been ranked as one of Europe’s strong innovators. Similarly, New Zealand has been investing in innovation and technology, particularly in the fields of agriculture and biotechnology. The country has also made it easier for small and medium-sized businesses to access patents and has implemented initiatives to support innovation. In Australia, the growth in issued patents can be attributed to the country's focus on research and development, particularly in the mining and resources sector, as well as in medical technology and biotech. Additionally, the Australian government has implemented policies aimed at encouraging innovation and entrepreneurship, which has contributed to the increase in patent activity.
- On the other hand, Bermuda tops the list of countries with the highest decrease in issued patents. The nation is renowned for its developed financial sector and offers several advantages, including offshore incorporation and low-tax jurisdiction. The reduction in the number of patents appears to be linked to the decline of some of its major players, such as Marvell Technology Group Ltd.
- The British Virgin Islands provides comparable tax advantages as Bermuda and swift incorporation processes, which draws startups to this location. As a small jurisdiction with limited population and resources, the decrease in the number of granted patents in the British Virgin Islands is primarily due to the companies incorporated there, not government policies.
- Luxembourg is another country, with modest patent activity but that has been declining during the past five years. While some entities such as ArcelorMittal based there have increased their numbers in issued patents, several others like Medtronic and SMR Patents Sàrl have been declining which seems to be the reason for their overall decline.
- It’s worth noting that countries with low average growth rates are not generally considered R&D-intensive. However, Austria and the Netherlands are exceptions to this rule as they have experienced modest declines, despite being significant players among foreign entities with over 5,000 and 20,000 patents issued during the past five years, respectively. Although the decrease percentage is less than 5% for Austria and Netherlands, it still translates to hundreds of patents in absolute terms. The decline for bothof these countries seems to have been impacted by a decline during 2022 when compared to 2021, but this might be temporary, as for both countries the European Patent Office has reported growing numbers.
In order to identify the countries where the most active foreign entities come from when obtaining patents in the United States, we ranked them based on reports from foreign assignees. The results reveal that Japan, China, and South Korea were the top three foreign assignees with the highest number of patents issued in 2022. This means that companies and individuals from these countries were the most active in seeking patent protection for their inventions in the United States. It is worth noting that these countries have a strong focus on research and development, and their innovative industries have been growing rapidly in recent years. As such, it is not surprising that they are among the top sources of foreign patents in the United States.

Although the ranking of the top countries when compared with those with the most patents issued in 2021 remains unchanged, there have been some developments. China has surpassed South Korea in patent issuances and is now ranked second among the countries with the most active foreign entities obtaining patents in the United States. Its consistent growth has created already a gap of nearly 6,000 issued patents more than South Korea. While the numbers of Japan and South Korea have remained steady in recent years, China's growth rate of 20% per year suggests that it may soon take the top spot if the Chinese entities manage to keep a similar growth rate for some more years. Germany’s and Taiwan’s positions look safe as they have distance from each other and other countries, while also having very moderate growth rates of less than two percent. Meanwhile, countries such as France, the UK, Switzerland, Canada, and the Netherlands have narrow differences from each other, and even modest growth or decline of under five percent can potentially impact their current positions in the chart. Moving forward, we will keep an eye on the patent trends of different countries and provide further insights and analysis in our upcoming reports.
The full Patent Intelligence Report delves deeper into the analysis of foreign and domestic entities and the most innovative US cities and states in terms of issued patents. It provides a detailed examination of filing and issuance trends from various perspectives, including the high-tech and biotech division, based on the Technology Center and art unit of the patent. For the first time this year, we have offered insights on some of the most important lateral moves for attorneys since the publication of our previous report in 2022. Besides the evaluation and ranking of 30,777 active patent attorneys and agents, 3,429 patent law firms, and 130,458 companies, foreign and domestic.
Stay tuned as in the coming weeks we will continue the coverage of this report with more insights and highlights related to patenting trends.