Patexia Insight 11: Most Litigated Technologies
Last week we published the result of our analysis of software patent suits since 2010, observing that such patent suits are on a rapid decline, post the Alice decision. This week, we’re expanding that analysis to include all patent lawsuits since 2010, identifying the highest areas of litigation since 2010. Software led the way with 14%, followed by Electronics (about 13%) and Life Science litigation (about 11%).
We also looked at each area individually, seeking to identify trends. We obtained especially interesting results for the Life Sciences and Telecommunications areas. This information is particularly useful, as law firms must budget their resources well into the future, given that many cases may take 2 to 3 years … and sometimes longer.

To construct the above pie chart, we identified 33,408 patent lawsuits filed in different district courts across the country from 2010 till the end of the first half of 2016. We then extracted the unique patents involved in each of the cases, discovering 22,791 unique patent numbers. After that, we identified the main U.S. Patent Classification (USPC) code for each of the patents and categorized them based on that code. Some of the categories, such as electronics and telecommunications are very similar.
| USPC Code | Class Definition | Patents in Suits |
|---|---|---|
| Software |
705,707,345,707,701,382,702,715,726,380,700,704, 717,704,703,706 |
3197 |
| Electronics & Semiconductor |
709,348,713,375,710,365,361,439,725,714,358,711,369, 174,381,360,310,320,257,438 |
2986 |
| Life Sciences | 514,435,426,436,536,546,548 | 2457 |
| Telecommunications | 455,340,370,379,342 | 1989 |
| Design Patents |
D07,D06,D02,D12,D26,D08,D09,D21,D14,D16,D03,D23,D13, D25,D11,D24,D22,D10,D15,D28,D30,D19,D34,D32,D29,D04, D27,D05,D18,D20,D99,D01,D17 |
1883 |
| Medical Device | 606,604,600,128,623,433,607 | 1060 |
| Chemistry and Material Science | 428,210,422,264,156,427,204,524 | 728 |
| Mechanical Engineering | 52,482,399,405,285,4,165,70 | 517 |
One of the trends that was particularly interesting was in Telecommunications, where the number of patents in suits had rapidly grown from 2010 to 2012 but then slowed down. Much of the quick rise may be attributed to the infamous smartphone wars between companies such as Apple and Samsung, as well as many other players, such as non-practicing entities (NPEs) over the past several years.

We should point out that the Telecommunication category we constructed here mainly covers wireless related patents. However, a lot of patents involved in the smartphone cases were about the microprocessors (Electronics) or the process of making those chips (Semiconductor) or the design of the device itself (Design Patents) or even sometimes related to the software applications designed for those devices (Software).
Although last week we showed that software suits were on a decline in terms of absolute number of patents per year, we decided to compare that relative to other types of suits to see if our last week’s observation changes. We noticed that even relative to other types of patents, software patents show the same decline. They peaked in 2013 at about 18%, but they then went down to about 14% in 2015, which was the lowest level since at least 2010.

"It is reasonable to conclude that the reduction in patent suits involving software is largely attributable to recent Supreme Court decisions. Such a marked decline demonstrates that the decision was not as narrow as the Court likely anticipated. Given the significant economic importance of software to the US economy, a dramatic shift like this should generate significant concern", says Manny Schecter, Chief Patent Counsel at IBM.
One area that has been consistently strong – and in recent years has also covered a larger percentage of all patents in suits – is Life Sciences. Although it consists of roughly 11% of all patents in suits since 2010, it has been rising in the past couple of years.
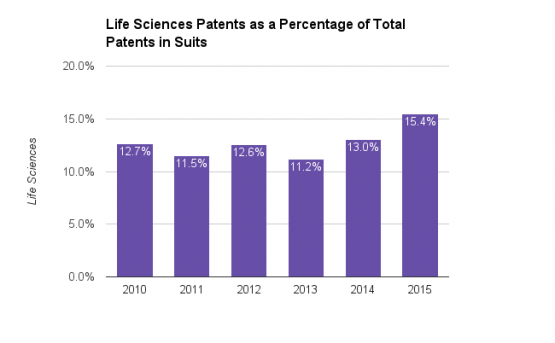
It is important to point out that these rises and falls are relative to each other. As we showed in another analysis a few weeks ago, the total number of unique patents involved in litigation has been declining in recent years. In other words, patent litigation is a declining market. So although the Life Sciences’ portion has been rising compared to other categories, in terms of absolute numbers it has been relatively constant, fluctuating between 500 and 650 patents per year.

Our analysis of technology patents involved in lawsuits since 2010 shows that software patents have been holding the largest percentage overall, but they have been on a steady decline since 2013. In the meantime, the Telecommunications category seems to be maturing and may even begin declining soon. On the other side, Life Sciences has been a constant category, showing strength relative to other categories in recent years.
In the following weeks, we plan to take a closer look at the law firms representing different sides in patent lawsuits (i.e., plaintiffs vs. defendants). We will identify the most active ones by not just looking at the number of cases they have been involved with, but also the number of patents they have litigated. Stay tuned...